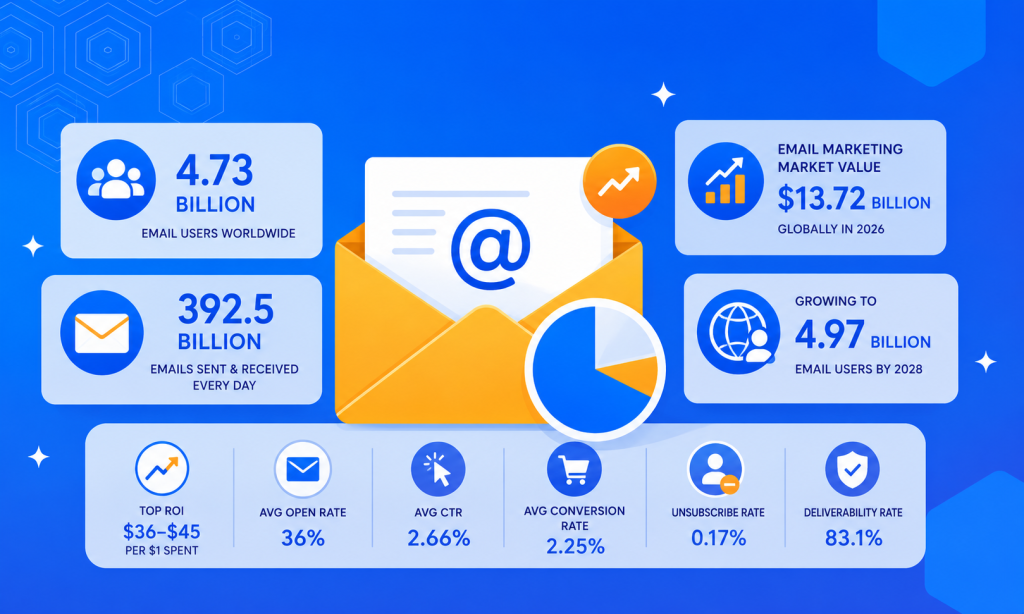
With billions of users globally and a rapidly increasing number of users as well as volume of sent emails on a daily basis, email marketing data analysis is the key to obtaining success in this sector. Without the proper statistical and numerical knowledge, it’s tough for businesses to project exactly what is a good percentage or number for your brand’s success. MailPai brings a massive collection of email industry data along with easily explained analysis that you may not know but should keep in your head.
Email Industry Data, Reports & Analysis
Before heading to the direct statistics, first know what email marketing data is, why they are important, and how to analyze it. Also know about the Core Metrics of Email Marketing Data Analysis.
The process of tracking and interpreting campaign metrics relevant to email marketing is known as email marketing data analysis. What are the core campaign metrics? Well, you have surely heard of these terms. The likes of open rates, click-through rates (CTR), conversions, bounce rates, unsubscribe rates, etc., are the core campaign metrics of email marketing data analysis.
Email Marketing Market Value
- The global email marketing industry has an overall market value of approximately $13.72 billion in 2026 and is rapidly increasing (Data Bridge Market Research).
- Research and Markets estimated the sum at more than $12.45 billion (US Dollars) and projected that the sum will go past $22 billion (USD) by 2030, and claimed a 15.4% CAGR.
- Indeed, some Artificial Intelligence Projections tell that the Market Value can go as high as $36.3 billion by 2033.
How many people are using email? (Global User Base)
- There is an estimated number of 4.73 billion users in the entire world in 2026. The number was 4.59 billion in 2025 and 4.48 billion in 2024 (Forbes).
- Forbes also estimated that 81% companies, 64% small businesses, 33% marketers use email marketing. 50% marketers consider email marketing as their most influential channel.
- The number of worldwide Email Users is set to grow to 4.97 billion users in 2028 (Statista).
How many emails are being sent per day? (Volumes)
- In the contemporary world, 392.5 billion emails are sent and received every day. (EmailToolster, Prosperity Media)
- The sum increased from 361.6 billion daily email transactions in 2024 (Forbes).
- Statista reveals that there used to be 376 billion daily email transactions in 2025, while it could have a projected uptrend of up to 424 billion within the coming 12-months.The
- Forbes also revealed that the USA takes the pole position as the country with the largest number of email sendings (10B per day). Germany and India come into the next spots with around 8.5 and 8.3 billion mail sendings respectively. Countries like Belgium, France, the United Kingdom, Japan, Ireland, the Netherlands, and Australia are also in the top 10. The prior 5 nations all send over 8 billion emails per day at the moment.
Number of emails sent per day globally via various providers
| Email Provider | Estimated Daily Emails Sent/Received | Estimated Active Users |
| Gmail (Google) | Over 121 Billion | Around 1.8 Billion |
| Apple Mail / iCloud | More than 60 Billion | App. 950 Million |
| Yahoo Mail | Over 8 Billion | App. 225 Million |
| Other Providers | Around 235 Billion | N/A |
Gmail is not only the most popular porvide with the highest number of active members but also is the platform to send/receive the most amount of mails per day.
Average Open Rates of Email Marketing
- In 2021, the average email open rate was 21.5% across all industries (Campaign Monitor).
- Median Open Rate is 43.46% according to the dataset of MailerLite.
- For government emails, the average email open rate is 40.55%, with the lowest average being around 27.34% belonging to vitamin supplement emails (MailChimp).
- Forbes has generalized it and calculated the average open rate for an email marketing campaign at 36.5%. Faith-Based Organizations stand at the top of their chart (45.50%), followed by Child Care Services (44.8%), Family and Social Services (42.7%), and Nonprofit Membership Organizations (42.3%). They also tell Personalized mails increases the open rate by 26%.
- Daily Email Open Rates differ by a small margin depending on various days of the week. Thursdays have a bit lower open rate (37.1%), with Saturdays having the highest open rates (37.6%), says Forbes.
Average Click-Through Rate (CTR) rate for email marketing
- MailChimp reports that the optimal CTR for an email marketing campaign is 2.66 percent, while ranging from 1-5% depending on industry. DashThis also cites a similar sum at 2.62%.
- A good click-through rate should be between 2-5% says Campaign Monitor.
- The average CTR across all industries is 3.25 percent as of Business.com.
- Average campaign CTR is 1.69%, while top 10 performers hit around 3.38% tells Klaviyo.
- Forbes‘ Top 5 businesses with the highest CTR rates are Technology Services (2.6%), Transportation Services (2.6%), Faith-Based Organizations (2.5%), Family and Social Services (2.1%), and Nonprofit Membership Organizations (1.9%).
What is a good Click-To-Open Rate (CTOR) for email marketing?
- The overall average email marketing Click-To-Open Rate (CTOR) typically ranges from 6% to 15% says EmailListVerify.com. Most datasets’ median baseline is around 6.8% to 10.5%.
- A good CTOR should fall between 6-17% according to Campaign Monitor. Industries with the highest CTORs are Real Estate, Education, Government & Politics, with an average Click-To-Open Rate of 14 to 17%.
- MoEngage cites a standard COTR standing around 14.1%.
Forward / Sharing Rate (How much is Good)
- The average email marketing forward or sharing rate ranges from 0.2% to 2%. Standard campaigns will have estimates around 0.2% to 0.5%, while seriously valuable campaigns can go over a percent to 2. (Agency Analytics).
- Growth-Onomics suggests that the forward rate of 0.5%–2% is very strong, but anything less than 0.1% means you need to improve.
What’s a good Conversion Rate for email marketing?
- Klaviyo unveils that Standard Campaigns have an average conversion rate of 0.32% to 5% meanwhile welcome series results in an average of 3% conversion rate, and Post-Purchase Follow-ups average around 6.8% conversion rate.
- Bloomreach states that Retail & E-commerce can have conversion rates of around 2.25-2.7%. The Travel & Hospitality industry averages 2.25%.
- Flowium researched and came to the conclusion that the Clothing & Accessories industry tops the normalized conversion rate chart with 0.08% average, but can reach up to 1.77% with a proper systematic approach.
What is the average ROI (Return on Investment) of Email Marketing?
- Overall, Internet Search and Research, the average Return on Investment (ROI) in Email Marketing lies between $36 to $42 (more specifically 36-40) for every $1 spending. (Benchmark Email)
- Email marketing ROI is generally $36 for every dollar spent, according to Forbes.
- The average ROI for marketing emails is between 3600% in the US and 3800% in the UK (Email Monday).
Revenue Per Email (RPE) / Revenue Per Recipient (RPR)
- Klaviyo revealed the average RPR (Revenue for Recipient) for an email is $0.11. For SMS, the average RPR is $0.12.
- Revenue Per Email (RPE) averages $0.12 – $0.36 per delivered email according to various sources.
What is a good email Deliverability Rate?
- The average email deliverability rate across the 15 ESPs tested by EmailToolster was 83.1%. Among those 16.9% unreached mails; 10.5% of emails end up in the spam folder, and the rest 6.4% of emails are considered undelivered.
- An email deliverability rate of less than 80% is poor, over 85% is good, and over 95% is excellent (EmailToolster).
- An excellent or desired average email delivery rate is typically above 95% (MailJet).
Email Deliverability by Mailbox Providers
| Mailbox Provider | Inbox | Spam & Missing |
| Gmail | 87.2% | 6.8% and 6% |
| Yahoo! | 86% | 14.6% and 9.8% |
| Microsoft | 75.6% | 4.8% and 9.2% |
| Apple | 76.3% | 14.3% and 9.4% |
Gmail holds the pole spot for providing the best deliverability rate to the inbox (87.2%) and Yahoo comes 2nd (86%).
What is the average Bounce Rate for email marketing?
- Forbes also calculated the average bounce rate for an email marketing campaign at 10.4%. The top 5 Businesses With The Lowest Bounce Rates are Repair and Maintenance (4.9%), Retail (7.7%), Independent Artists, Writers, and Performers (8.5%), Dining and Food Services (9%), and Faith-Based Organizations (9.6%).
- Campaign Monitor sets the benchmark for bounces at less than 2%.
- According to Reddit, even 5% bounce rate is ok and less than 2% is definitely suggested by most sources. But there are many marketers who are unconcerned even with a 7 to 8% bounce rate.
What is the average Unsubscribe Rate for emails?
- Average unsubscribe rates differ based on various industries, typically ranging from 1% to 2% (MailChimp).
- Unsubscribe rates under 2% are normal according to Campaign Monitor, which has found the average number at 0.17%.
- MoEngage reveals the average unsubscribe rate is the lowest in the Financial Services industry (0.23%) and the highest in the Media & Entertainment industry (1.98%), while their estimated average is 0.82%.
- Brevo estimated an average unsubscribe rate of 0.46%, while the sum is as low as 0.05% for the top 10 performers.
What’s a good email List Growth Rate?
- UK Marketing Management Ltd confirms that a healthy list will grow between 2% and 5% per month. Hence, the annual growth rate would be between 25% to 35%.
- Mail Meteor suggests that marketers should desire an email list growth rate of 2.5% or more. They have warned that if the growth rate is less than 1% per month, then it requires improvement.
- Gozen.io also agrees that the average list growth rate is found to be 2.5%.
What is a good Spam Complaint Rate?
- According to the GDMA Email Benchmark, the worldwide average spam complaint rate is just 0.014% (MailMend).
- Active Campaign and a few other sources suggest that an excellent Spam Complaint Rate is less than 0.01%, while less than 0.1% is acceptable, 0.1 to 0.3% is the danger zone, and over 0.3% is critical for your business.
How to analyze email marketing data?
Follow a few steps to make a better output.
Establish Benchmarks: Find out the average open and click rates for your specific industry and figure out how much you should obtain to be considered good enough.
A/B Testing (Split Testing): In this process, send two variations of an email to two different subsets of your contact list. Then find out which sort worked better and apply that on a larger scale.
List Segmentation: Based on recipients’ engagement history (e.g., highly engaged vs. inactive) or behavioral data (e.g., cart abandonment), make segmentation of the list. Generalizing sending won’t bring fruitful results.
Revenue Attribution: Assess the sales data and email marketing campaign features & cost to have a clear idea about generation of revenue per campaign.
Why is data important in email marketing?
Data analysis is crucial in successful email marketing. The key factors include:
Guides you on what to do: The data analysis transforms raw engagement metrics into actionable insights.
Data-Driven Decisions: The core metrics data help you find out what content resonates and what falls flat. You can have a clear idea about your content and its success rates and what they are bringing to you, profits or losses.
Deliverability Development: Counting out the positive impressions and interactions (link clicks, replies, etc) helps you estimate how trustworthy your content is becoming and shapes your way ahead by developing sender reputation and inbox placement.
Recipient Segmentation: The email marketing data analysis also helps you figure out the past actions or behaviors of your recipients. So, rather than going for the same action for all, you choose to go category-wise based on what a recipient wants. Individuals who belong to the same category would get similar messages, and they would differ from group to group.
Figure Out Purchasing Intent: Without proper data analysis, it would have been hard to recognize the clients’ buying intent. Their response and engagement data help sales and marketing teams to figure out exactly when they should make an approach and follow-ups.
Bettering Return on Investment: Proper data analysis helps you avoid randomization, hence it decreases unsubscribe or bounce rates while increasing conversion rates. Thus, it lowers your budget & time waste but improves the ROI.
FAQs on Email Marketing Industry Data Analysis
Can ChatGPT analyze my emails?
ChatGPT can be very useful in analyzing your email data. Users can use direct integrations, copy-and-paste methods, or upload exported data based on the extent to which they want the solution.
What is an average open rate for email campaigns?
The average open rate for an email marketing campaign is around 36%. It can vary based on industry, region, and type of mail.
Is a 25% email open rate good?
It can be good based on your industry. There are many industries whose average open rate is between 15 to 25%. But overall, it’s a bit below average and not considered a strong or solid open rate.
Is a 45% open rate good?
Yeah, for sure. That’s an impressively strong open rate.
What is a good click rate for email marketing?
Basically, the average campaign CTR is around 1.69%, while varying highly between 1-5%. An optimal CTR rate is around 2.66%.
How many email accounts are there worldwide?
There are roughly 5.6 billion active email accounts. However, with an average person owning 1.8 email IDs, these accounts belong to 4.6 billion different people.
What is the average number of emails per day?
An average person receives a staggering 121 emails per day.